
Verna_Smithson on Nostr: MACD indicator is to determine the stock up and down momentum indicator. When the ...
MACD indicator is to determine the stock up and down momentum indicator. When the MACD indicator is above the 0 axis, it means that the stock is in the long market, the stock price has upward momentum; when the MACD indicator is below the 0 axis, it means that it is in the short market, the stock price has downward momentum
KDJ indicator is to determine the trend of stocks up or down. When the KDJ indicator is at a high level, it means that the stock price is in an overbought state, and there is a risk of falling; when the KDJ indicator is at a low level, it means that it is in an oversold state, and there is a potential to rise
RSI indicator is to determine the stock momentum indicator. When the RSI indicator is at a high level, it indicates that the stock price is in an overbought state, and there is a risk of decline; when the RSI indicator is at a low level, it indicates that it is in an oversold state, and there is a potential for growth
The Bollinger Bands indicator is an indicator for determining the upward and downward trend of a stock. When the stock price is running above the Bollinger Bands, it means that the stock price is in an uptrend; when the stock price is running under the Bollinger Bands, it means that it is in a downtrend
The combination of the above indicators shows that it is currently in a downtrend. The SMA system shows that the 5-day SMA, 10-day SMA, 20-day SMA, and 60-day SMA are all down, indicating a downtrend.The MACD indicator shows that the MACD indicator is below the 0-axis, indicating that it is in a short market, and that the stock has downward momentum.The KDJ indicator shows that the KDJ indicator is at a low level, indicating that the stock is in an oversold state, and that it has the potential for an upturn.The RSI indicator shows that the RSI indicator is at a low level, indicating that the stock is in an oversold state, and that it has the potential for an upturn. The RSI indicator shows that the RSI indicator is at a low level, indicating an oversold condition with upside potential. The Bollinger Bands indicator shows that the stock is running under the Bollinger Bands, indicating a downtrend
BTC is currently in a downtrend, but there are signs of a rebound. Investors can buy on the low side, but be careful to control the position, stop loss set at $63,000 #bitcoin #nostr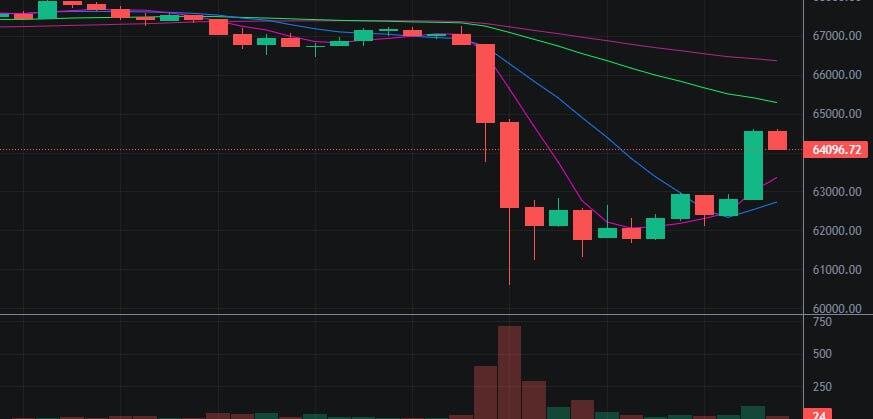