Dr. Jeff on Nostr: Net Liquidity and Global M2 Update: US Net Liquidity (upper chart) tried and failed ...
Net Liquidity and Global M2 Update:
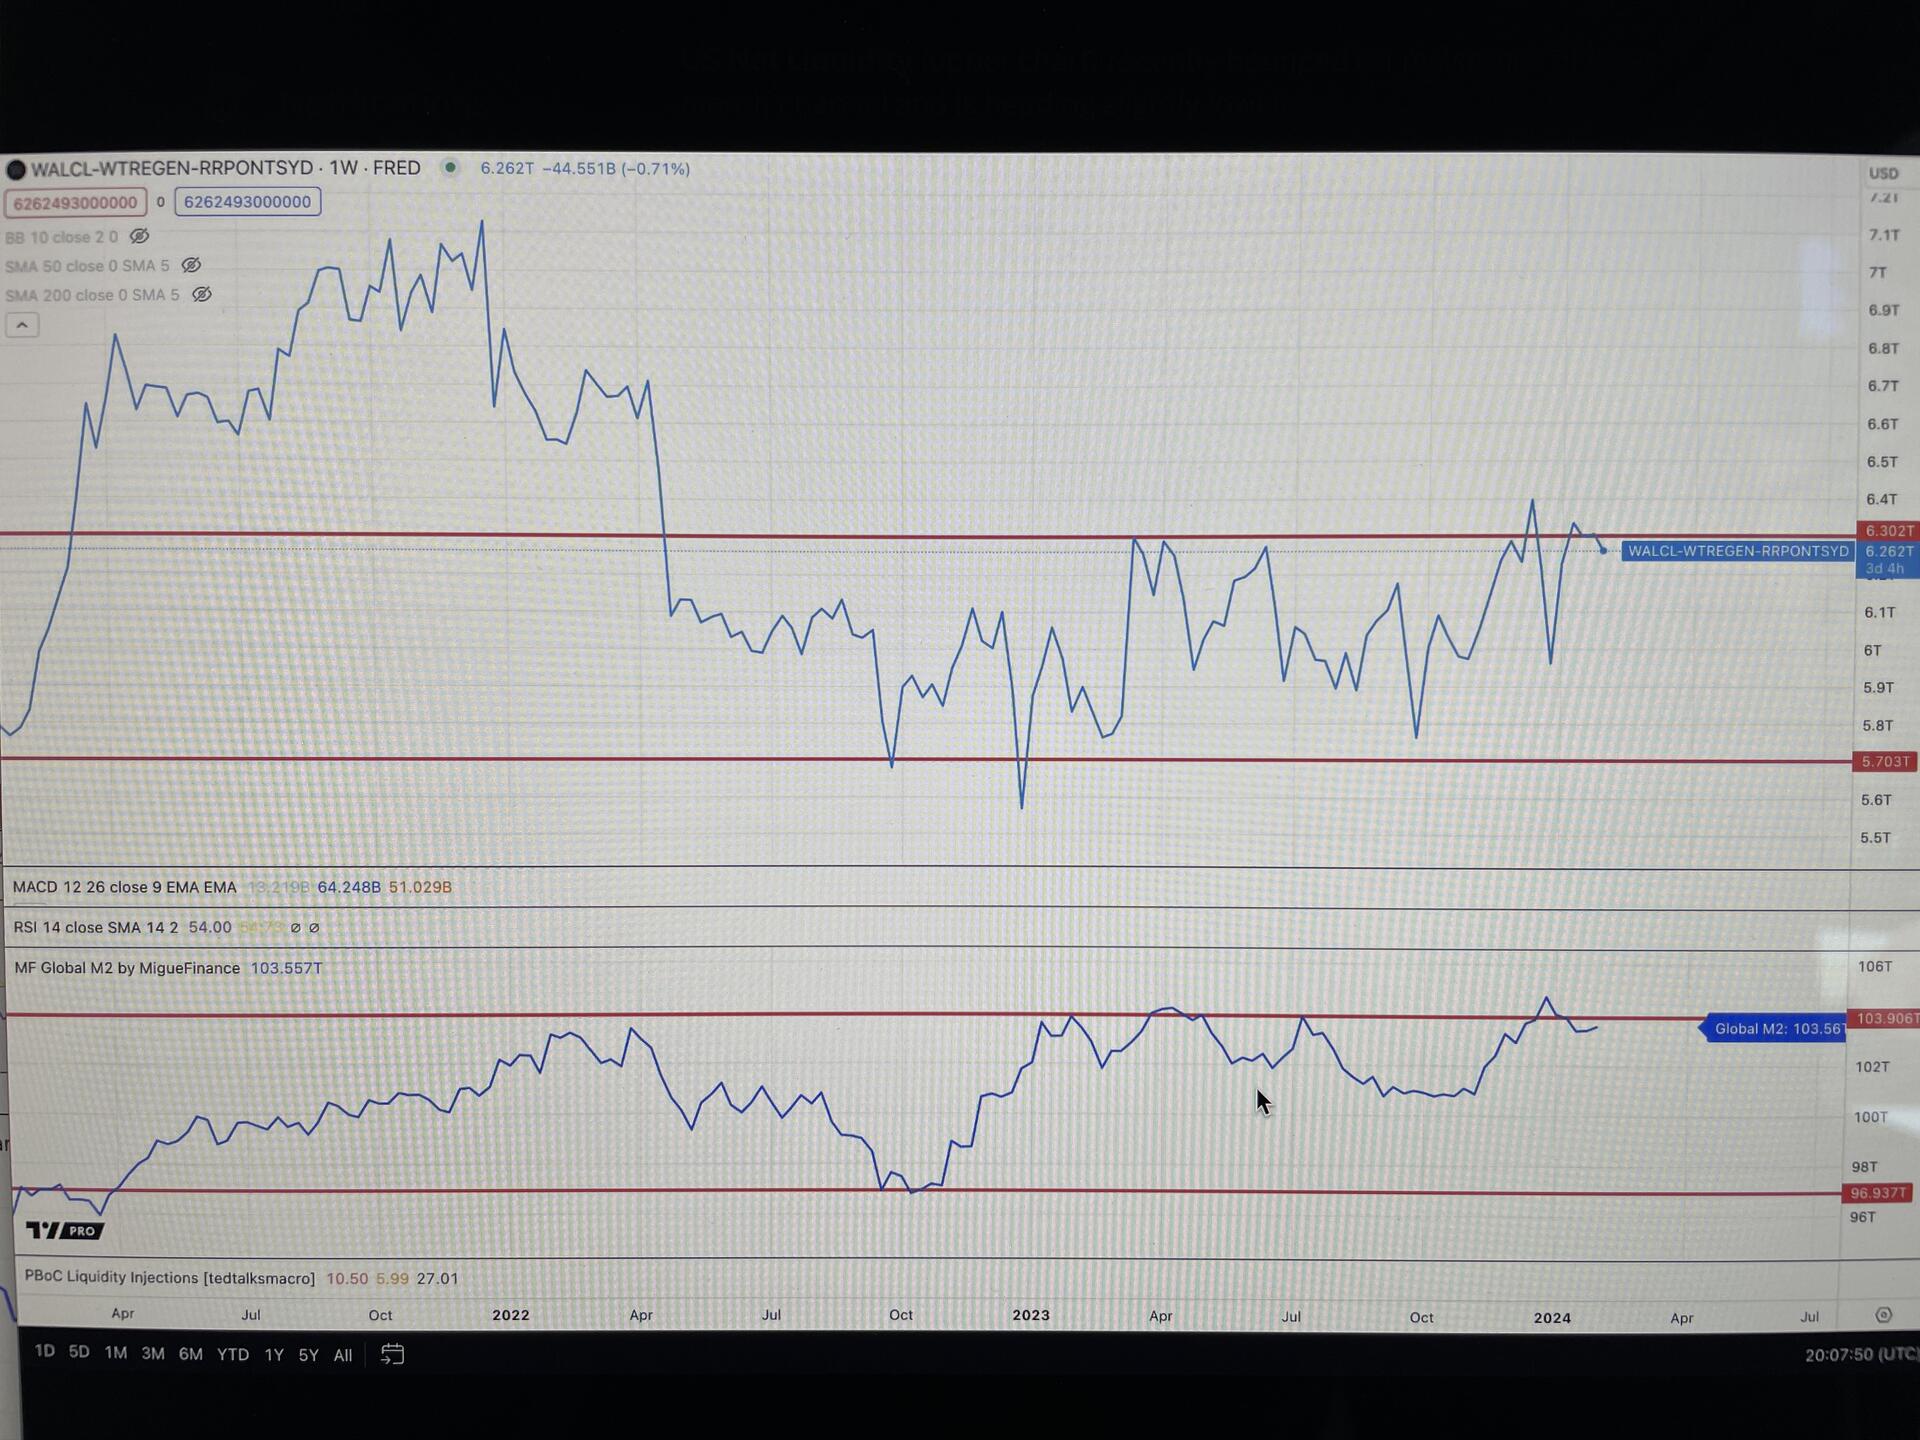
US Net Liquidity (upper chart) tried and failed to break out of its two-year range and has recently turned lower.
OPINION #1: Ongoing bullcrabby implications (sideways chop around local highs) in the near-term for US small and mid-cap equities.
Global M2 (approximate; lower chart) continues to trend sideways near the upper end of resistance within its three-year channel.
OPINION #2: Until this trend changes, I expect continued choppy sideways ("crabby") price action of worldwide assets near local highs. 🦀These may include: #bitcoin, #gold, FAANG+ stocks, and $QQQ, among others.
OPINION #3: Continue to respect the bullcrab environment. In other words, lean bullish... but not overly bullish... and definitely not bearish.
(Not individual investment advice! For infotainment purposes only!)

