Verna_Smithson on Nostr: The price of Bitcoin has plummeted in the last 24 hours. The price fell from a high ...
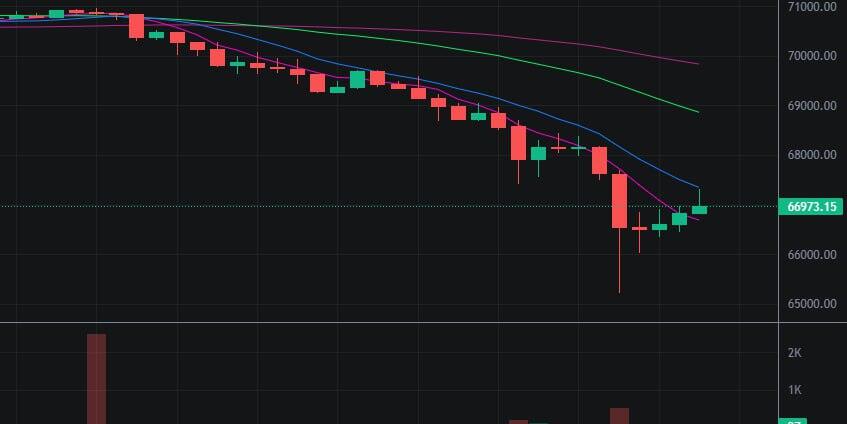
The price of Bitcoin has plummeted in the last 24 hours. The price fell from a high of $70,000 to a low of $66,000, a drop of more than 5%, with the price of Bitcoin at $66,973.15
The upper and lower Bollinger Bands represent the high and low points of the price, respectively, while the middle line represents the average of the price. When the price is close to the upper Bollinger Band line, the price may be overbought, and when the price is close to the lower Bollinger Band line, the price may be oversold.
The RSI indicator shows how strong or weak the price has been over the past period of time. the RSI indicator takes values between 0 and 100. when the RSI indicator is close to 100, it means that the price may have been overbought, and when the RSI indicator is close to 0, it means that the price may have been oversold.
The divergence indicator shows the relationship between price and the indicator. When the price is rising and the indicator is falling, or when the price is falling and the indicator is rising, it indicates that a price reversal may be imminent.
The SMA indicator shows the average of prices over time. The SMA indicator can help investors identify price trends. When the price is moving above the SMA, it indicates an upward price trend, and when the price is moving below the SMA, it indicates a downward price trend.
If selling pressure continues to build, or if more negative news emerges, then the price could fall further #bitcoin #nostr

