freeonlineuser on Nostr: ...

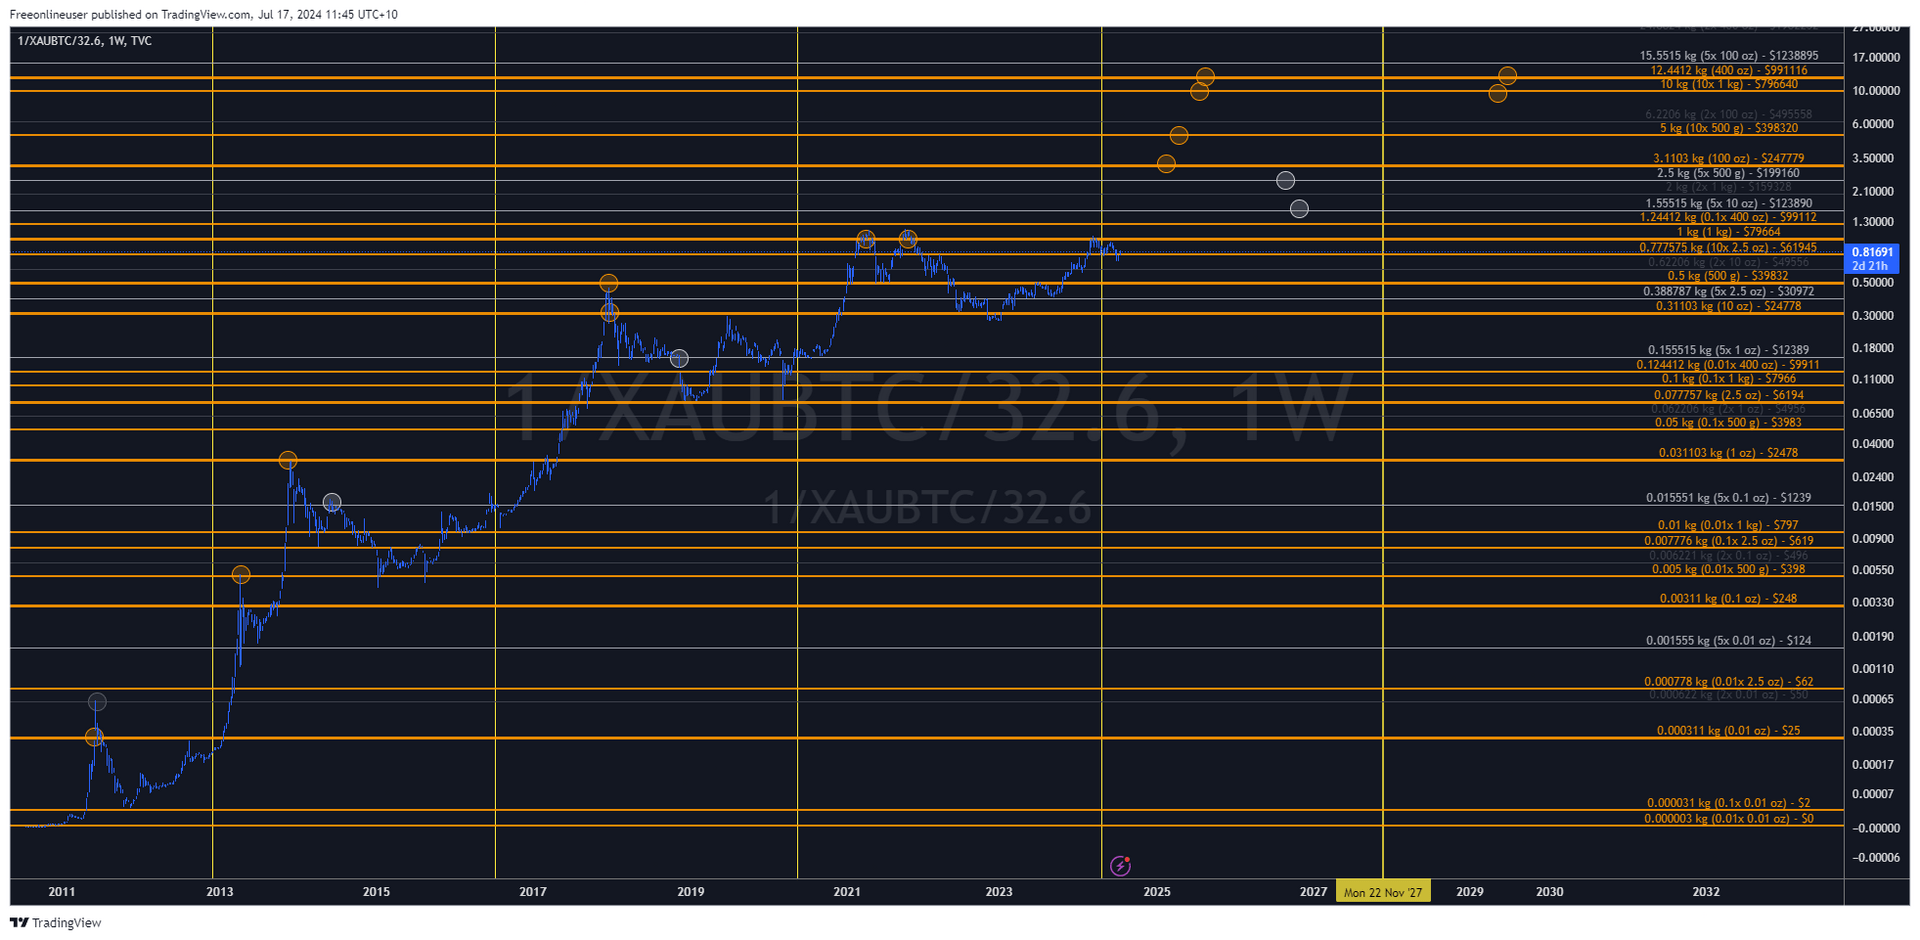
This is a chart of bitcoin unit bias intersecting with gold unit bias. Enjoy.
The transition from gold to the worlds hardest money will happen at a speed determined by the issuance rate set by Satoshi in the bitcoin code. It's clear to me from this chart that during this transition humans will continue to use phycological biases to decide how to enter this new asset class. A trader sees they can buy a 1oz gold bar for 1btc and takes the trade.
The future circles are not a prediction, just an example of how these levels may come into play in the future bull runs. $1M btc could occur in the next cycle or two. Gold is represented in kg on the y axis, and the prices on each line are based on current gold price.
This is a pine script indicator I built for myself in tradingview. It shows commonly traded gold units, and the major multiples and division of these units. I made a similar indicator that I enjoy, that represents the same lines as they move dynamically with gold price on the standard btcusd chart.
Published at
2024-07-17 01:50:32Event JSON
{
"id": "c1a45ba8ea9a3c10aa18c80557e3fb95d0511bcefe12e71f20f4425cdc7c202c",
"pubkey": "d92fe1eabfcee0e161f4a43e142ad82462e93ea0406f9f915033ceea36c0904f",
"created_at": 1721181032,
"kind": 1,
"tags": [
[
"imeta",
"url https://image.nostr.build/b849fb1ec5cb83a74887bfd7a80e630c0f54846658b4ce521c1bb4c784f8a853.png",
"blurhash LF8gvzayofj?RPayj[ay~qfRayj[",
"dim 1920x940",
"x a2e2c01ab426c793ef0c58859542f4ca9ebb31287d1650a60b1a847bfd8da991"
],
[
"imeta",
"url https://image.nostr.build/915f08e2ab6a956b61a8223be76611fefbbd1d5cd0794474d2b335d4dee68ce1.png",
"blurhash LF8gvzayofj?RPayj[ay~qfRayj[",
"dim 1920x940",
"x 4039cd182d488122e3f52e1387c71947a191be5a6e49fb0def58a623e820a2af"
]
],
"content": "https://image.nostr.build/915f08e2ab6a956b61a8223be76611fefbbd1d5cd0794474d2b335d4dee68ce1.png\nThis is a chart of bitcoin unit bias intersecting with gold unit bias. Enjoy.\n\nThe transition from gold to the worlds hardest money will happen at a speed determined by the issuance rate set by Satoshi in the bitcoin code. It's clear to me from this chart that during this transition humans will continue to use phycological biases to decide how to enter this new asset class. A trader sees they can buy a 1oz gold bar for 1btc and takes the trade.\n\nThe future circles are not a prediction, just an example of how these levels may come into play in the future bull runs. $1M btc could occur in the next cycle or two. Gold is represented in kg on the y axis, and the prices on each line are based on current gold price.\n\nThis is a pine script indicator I built for myself in tradingview. It shows commonly traded gold units, and the major multiples and division of these units. I made a similar indicator that I enjoy, that represents the same lines as they move dynamically with gold price on the standard btcusd chart.\n",
"sig": "0a8eb74982987a1c37cb3c5c15bd3e080d74accac9863c1510cfee9ec13d992d6435d4a78c3f135e2c80af6ade3f22a8c3446ca75c2fa445ae18d5679366ea3b"
}

