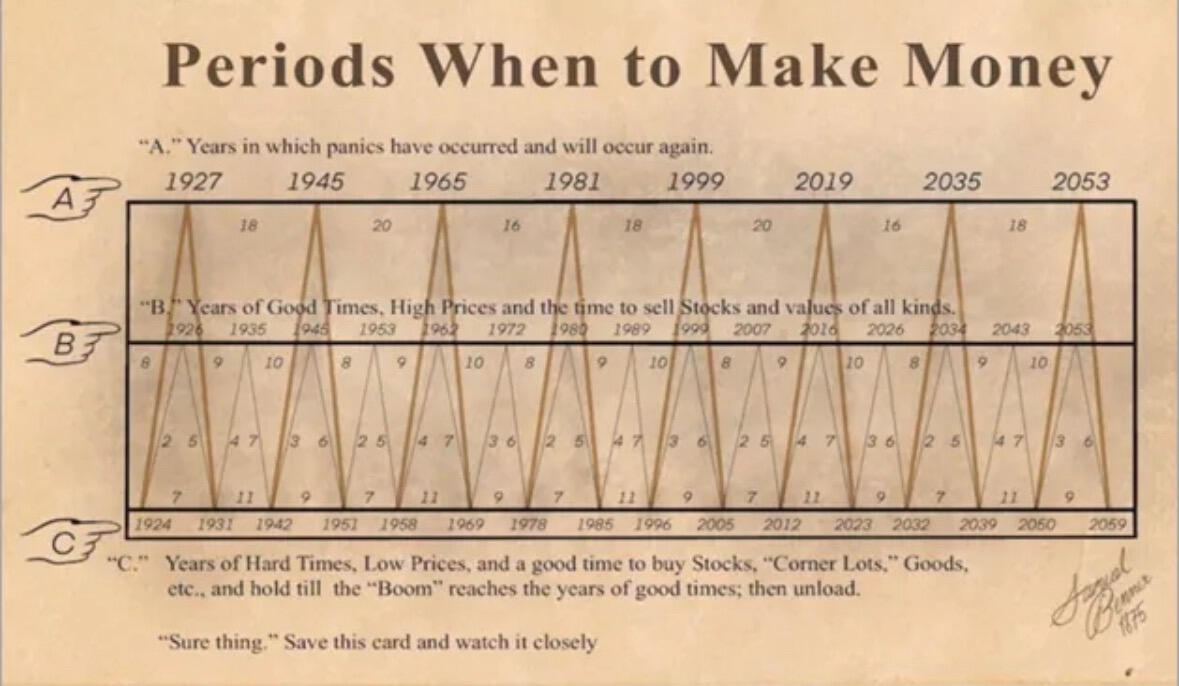
matta on Nostr: attributed to financial analyst Samuel Benner from the 19th century,“Benner’s ...
attributed to financial analyst Samuel Benner from the 19th century,“Benner’s Prophecies”.
created in the 1870s, this chart aimed to predict economic cycles
Here’s a breakdown of each part:
1. “A” Years – Years of predicted economic panics or downturns. Benner observed that certain years tended to mark downturns or financial crises, which he documented as part of cyclical trends.
2. “B” Years – Years of high prices and economic booms. Benner identified these years as optimal times to sell investments, as market valuations were likely peaking.
3. “C” Years – Years of low prices and economic difficulties. According to Benner, these were the best years to invest, as prices were expected to be at their lowest, making it a good time to buy and hold assets for future gains.

