Zack Labe on Nostr: Our warming planet... so far. Graphic: ...
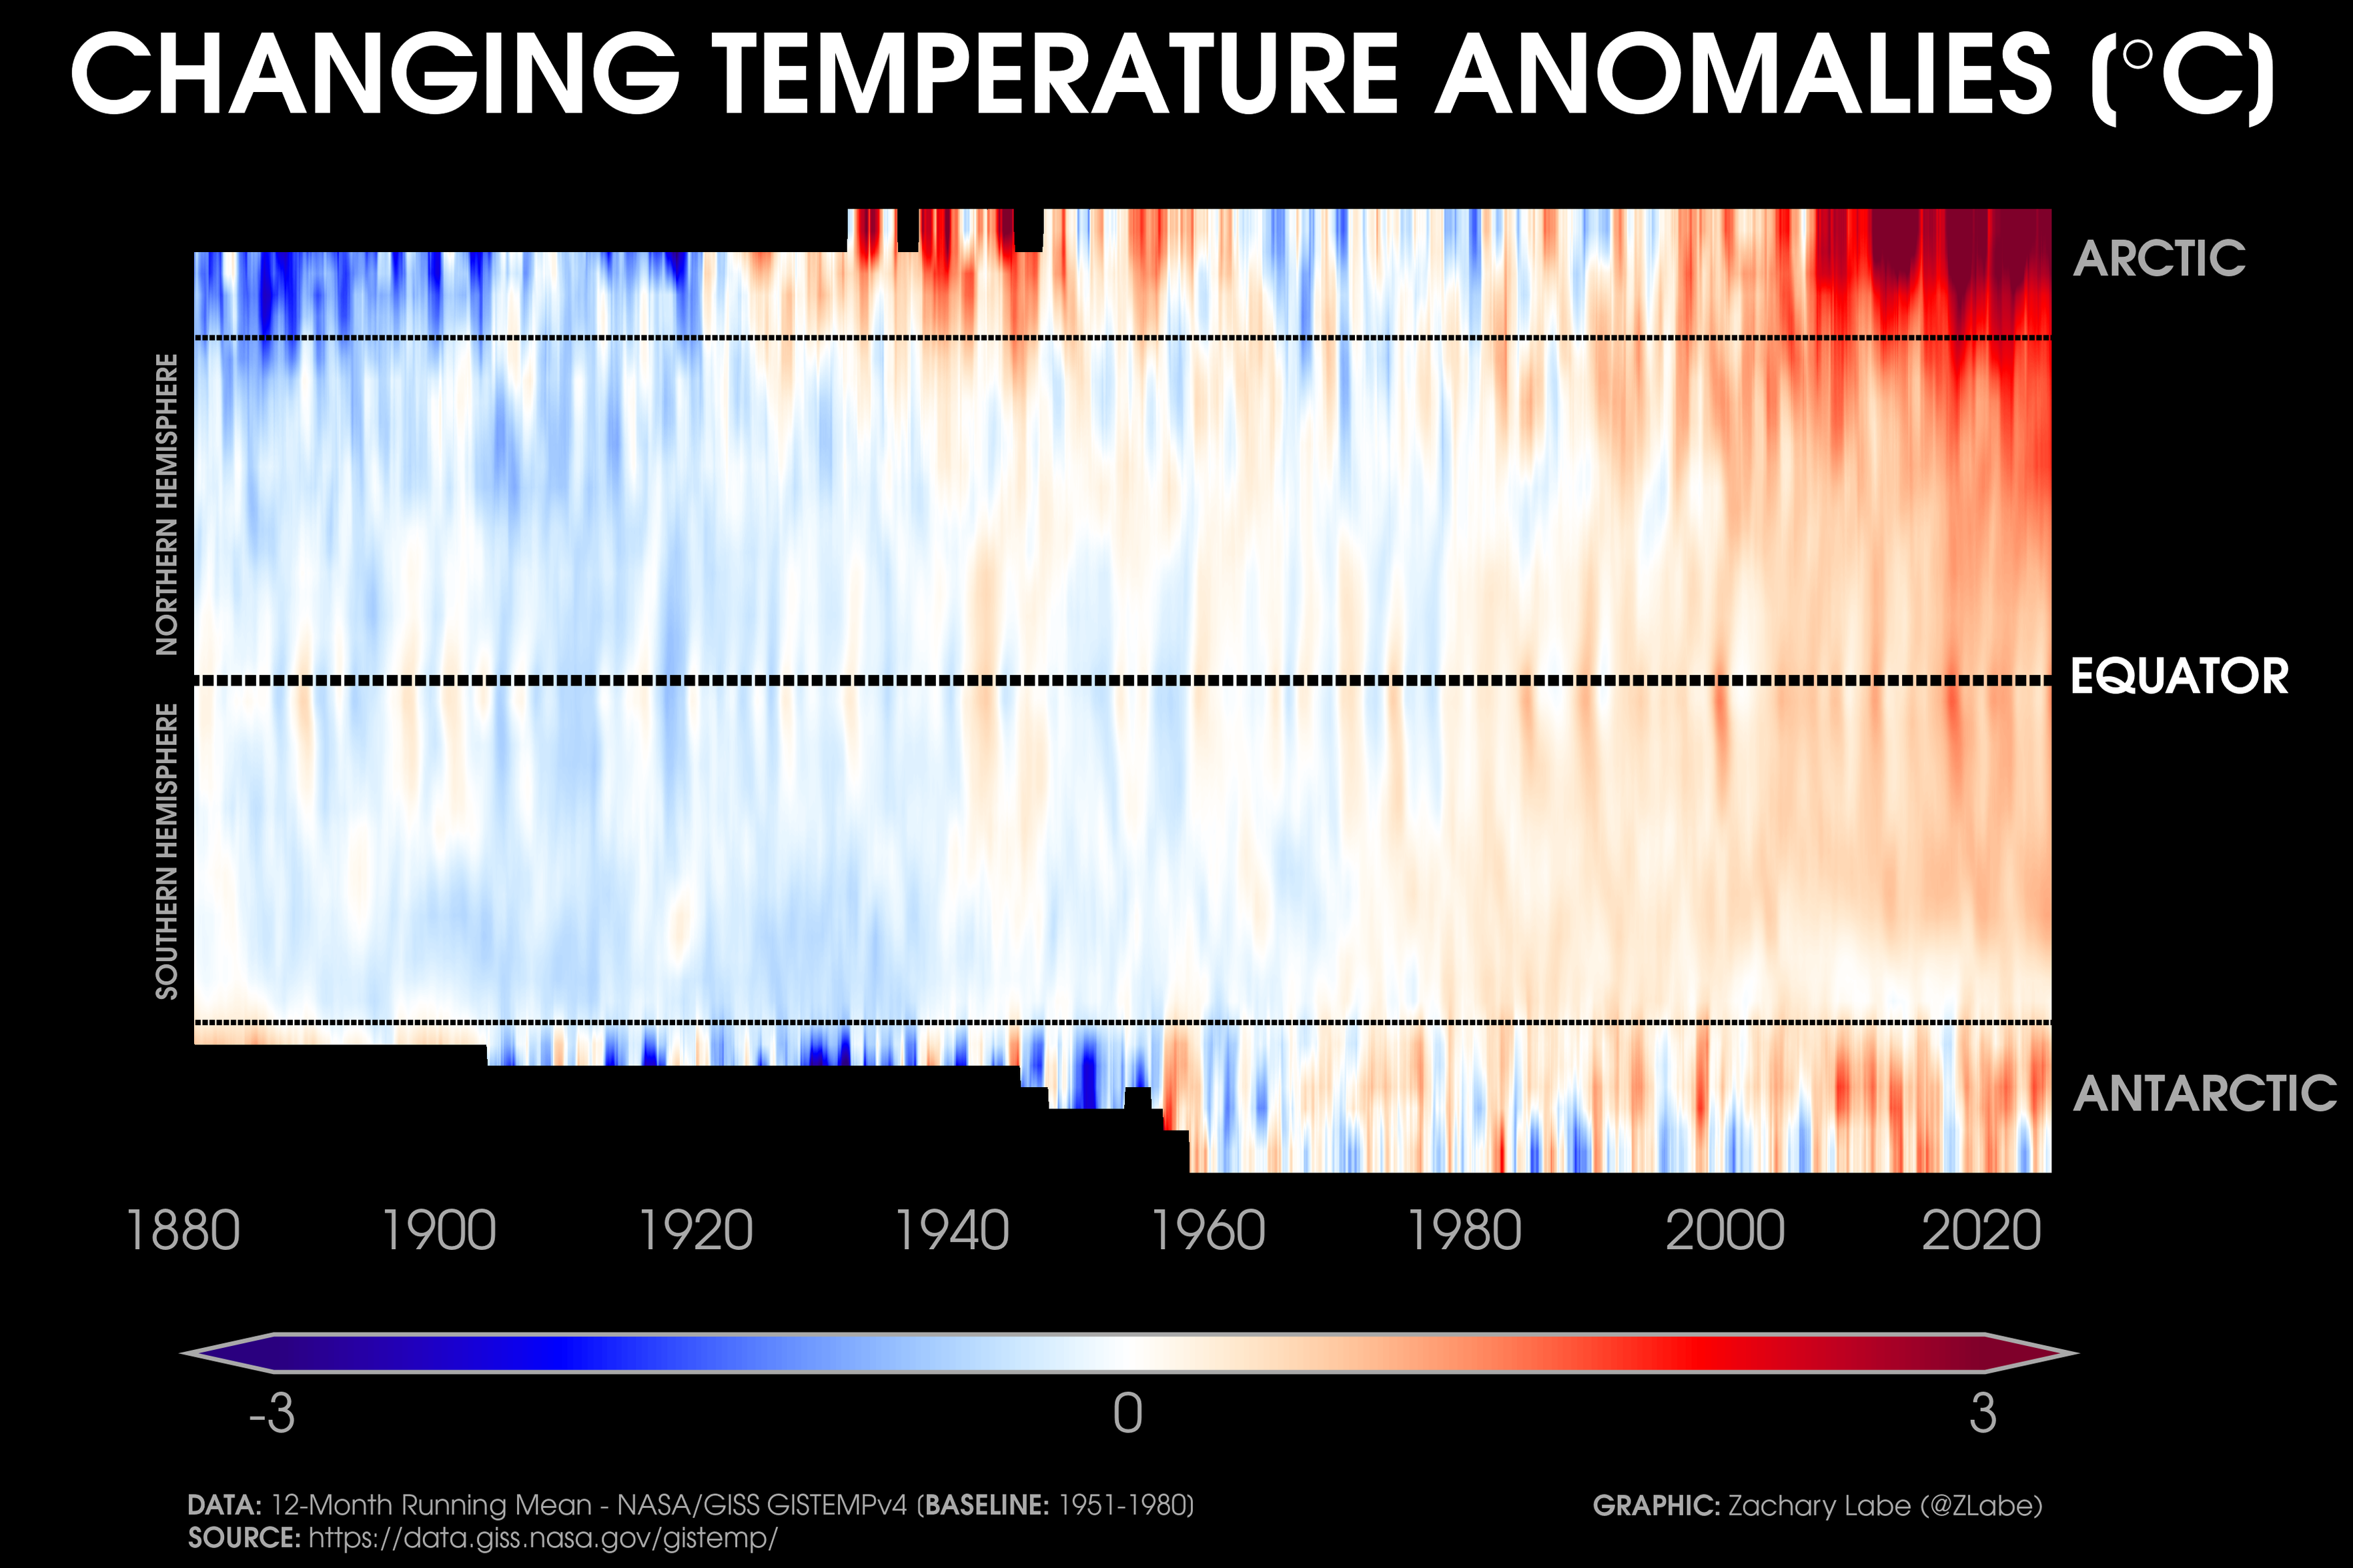
Our warming planet... so far.
Graphic: https://zacklabe.com/climate-change-indicators/
The y-axis is latitude, and the x-axis is time. Data: https://data.giss.nasa.gov/gistemp/ using a 12-month running mean through 2023. Black areas in early years are missing data (polar).

Graphic: https://zacklabe.com/climate-change-indicators/
The y-axis is latitude, and the x-axis is time. Data: https://data.giss.nasa.gov/gistemp/ using a 12-month running mean through 2023. Black areas in early years are missing data (polar).
