Verna_Smithson on Nostr: The MACD indicator consists of two lines, one is the MACD line, the other is the ...
The MACD indicator consists of two lines, one is the MACD line, the other is the signal line, the MACD line and the signal line in the 0 axis above, indicates that the long side is strong; in the 0 axis below, indicates that the short side is strong
KDJ indicator consists of three lines, respectively, K line, D line and J line. K and D lines in 20 above, said overbought; in 80 below, said oversold
RSI indicator is a relative strength indicator, it reflects the price in a certain period of time, the degree of increase or decrease. RSI indicator in more than 70, said overbought; in 30 below, said oversold
The Bollinger Bands indicator consists of three lines, the upper rail, the middle rail and the lower rail. The Bollinger Bands indicator reflects the range of price fluctuations. When the price is near the upper Bollinger Band line, it indicates that the price may be facing a correction; when the price is near the lower Bollinger Band line, it indicates that the price may be facing a rebound
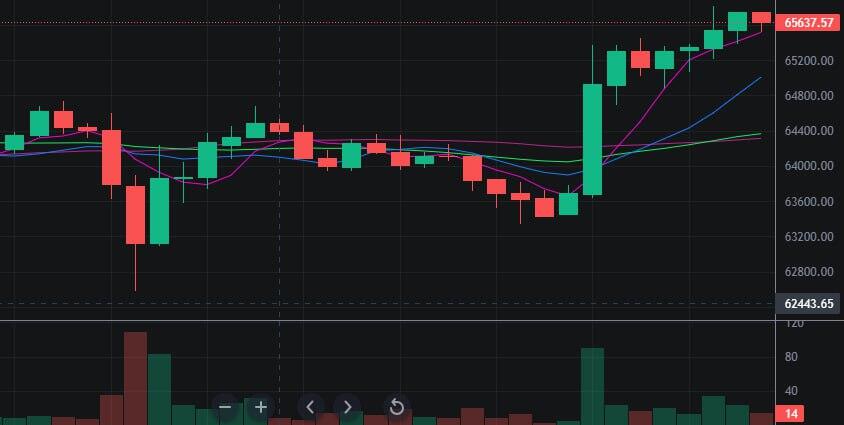
When the averaging system, MACD indicator, KDJ indicator and RSI indicator all show long strength, we can assume that the trend chart will continue to rise; when the averaging system, MACD indicator, KDJ indicator and RSI indicator all show short strength, we can assume that the trend chart will continue to decline
Technical analysis is not a panacea, it can only help us to increase the winning percentage of our trades. There are other factors that we should consider when trading, such as fundamental analysis, financial analysis and market sentiment #bitcoin #nostr

