
Verna_Smithson on Nostr: The 5-day SMA is a short-term SMA, which has a greater impact on short-term price ...
The 5-day SMA is a short-term SMA, which has a greater impact on short-term price movements. 10-day SMA is an intermediate-term SMA, which has a greater impact on intermediate-term price movements. 20-day SMA is a long-term SMA, which has a greater impact on long-term price movements. 60-day SMA, 120-day SMA, 250-day SMA are long-term SMAs, which have a greater impact on long-term price movements
The MACD indicator is used to measure the momentum of the BTC price movement.The MACD indicator consists of two lines, one is the MACD line and the other is the signal line.When the MACD line and the signal line are above the 0-axis, it indicates that the price is in a long market, and when they are below the 0-axis, it indicates that the price is in a short market. When the MACD line diverges from the signal line, it indicates a possible price reversal
The KDJ indicator is used to measure the strength of the BTC price movement. the KDJ indicator consists of three lines, one is the K line, one is the D line, and the other is the J line. the K, D, and J lines above the 0 axis indicate that the price is in a strong market, while below the 0 axis indicates that the price is in a weak market. When the K, D and J lines diverge, it indicates a possible price reversal
The RSI indicator is used to measure overbought and oversold BTC price action.The RSI indicator takes values between 0 and 100. When the value of the RSI indicator is above 70, it means that the price is overbought, and below 30, it means that the price is oversold. When the value of the RSI indicator is near 50, it means that the price is in equilibrium
The Bollinger Bands indicator is used to measure the trend of BT price action. The Bollinger Bands indicator consists of three lines, one is the center rail line, another is the upper rail line, and another is the lower rail line. The center rail line is the average price of the stock, the upper rail line is the highest price of the price and the lower rail line is the lowest price of the price. When the price is near the upper line, it means that the price is in a strong market, and when it is near the lower line, it means that the price is in a weak market. When the price is near the center line, it means the price is in equilibrium
BTC is currently in an oscillatory consolidation phase. The stock price is oscillating around the 5-day SMA, 10-day SMA and 20-day SMA, and the MACD indicator, KDJ indicator, RSI indicator and Bollinger Bands indicator all show that the price is in a state of oscillation, waiting for the price to break out of the oscillation range before making further moves #nostr #Bitcoin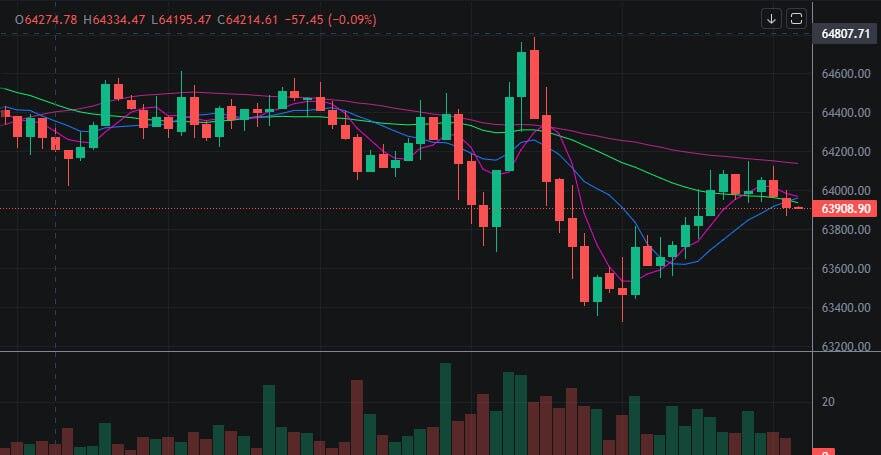