
CryptoHeathen on Nostr: Bitcoiner Price Index - November 2024 Update The latest update in Consumer Price ...
Bitcoiner Price Index - November 2024 Update
The latest update in Consumer Price Index for All Urban Consumers, adjusted for Bitcoiners
Introduction
Welcome to this month's edition of the Bitcoiner Price Index, where we explore the evolving cost of living on a Bitcoin Standard. By adjusting the latest Consumer Price Index (CPI) data from the Federal Reserve Economic Data (FRED) for the price of Bitcoin, we aim to illustrate how the purchasing power of goods and services shifts in terms of BTC compared to USD. This index offers unique insight for those who measure their wealth in Bitcoin and seek to understand the long-term impact of currency debasement and market fluctuations on their daily expenses. Let's dive into the latest data and see how our purchasing power stacks up this month.
November CPI Update
According to the latest update via the Federal Reserve Bank of St. Louis on December 11, the Consumer Price Index for All Urban Consumers (CPI-U) increased 0.15 percent on a seasonally adjusted basis in November, the same increase as the previous 3 months.
The all items index increased 2.73 percent for the 12 months ending November, 2024.
Adjusting for Bitcoiners
While the Consumer Price Index (CPI) measures the average change over time in the prices paid by urban consumers for a market basket of consumer goods and services, it needs to be adjusted for those living on a Bitcoin Standard to reflect the cost of those goods and services relative to BTC.
The price of Bitcoin on 11/30/2024 was approximately $96,536.75.
The all items index measured in BTC fell -47.93% for the 12 month ending November, 2024.
I’d also like to note that the $96,536.75 price of BTC is +156.35% from $37,658.08 on 11/30/2023, one year ago. Looking back four years ago, it is +398.06% from $19,382.36 on 11/30/2020.
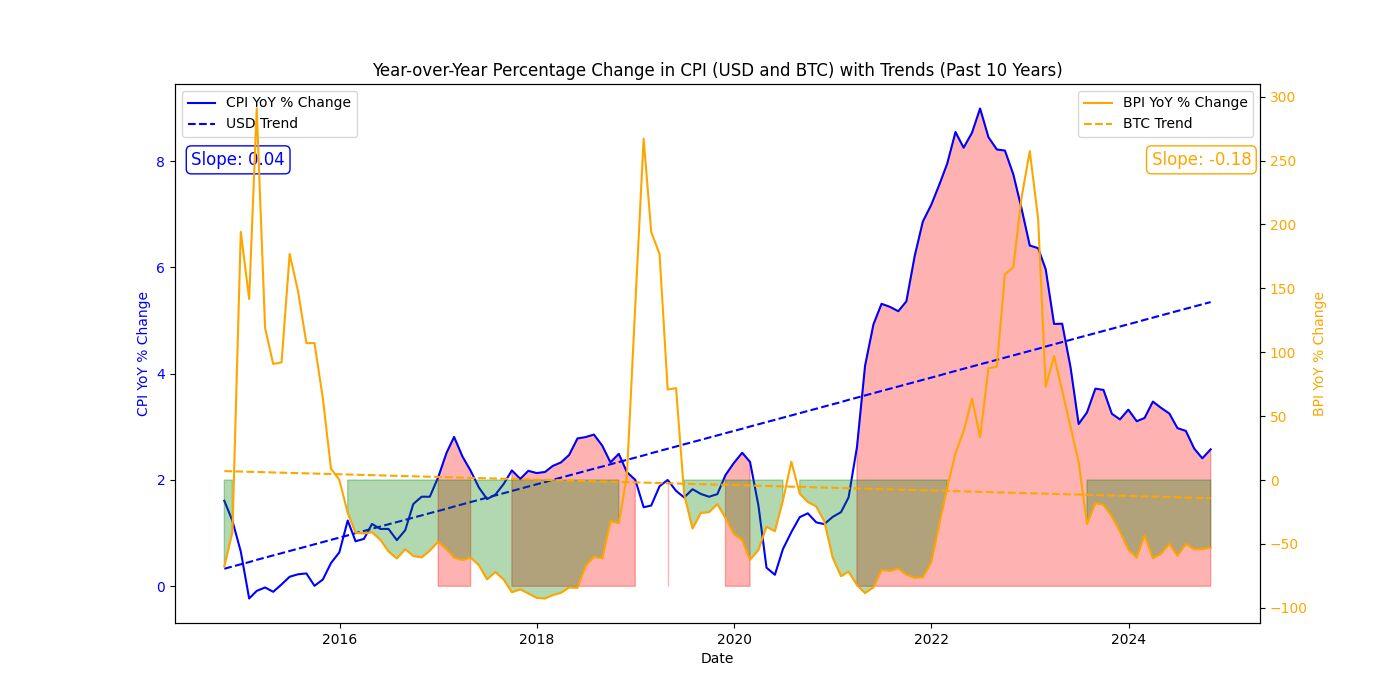
Bitcoiner Price Index Chart November 2024
Trends
Including this data in my previous analysis of the last decade, the year-over-year trend in CPI remains steady at 0.04%, while the trend in BPI is now -0.18%. This suggests a slow but consistent increase in the cost of goods and services for those living on a US Dollar standard, and a gradual but accelerating decrease in costs for those living on a BTC standard.
It is worth noting that there are extremely sharp increases in BPI seen in 2015, 2019, and 2023, but despite this, the average year-over-year % change in costs of goods and services for Bitcoiners is still decreasing at over 4x the rate that prices are increasing in USD terms.
If you enjoyed this post or found the information useful, follow me here or subscribe for free on substack to receive an email whenever there is a new update!
https://cryptoheathen34.substack.com/
The latest update in Consumer Price Index for All Urban Consumers, adjusted for Bitcoiners
Introduction
Welcome to this month's edition of the Bitcoiner Price Index, where we explore the evolving cost of living on a Bitcoin Standard. By adjusting the latest Consumer Price Index (CPI) data from the Federal Reserve Economic Data (FRED) for the price of Bitcoin, we aim to illustrate how the purchasing power of goods and services shifts in terms of BTC compared to USD. This index offers unique insight for those who measure their wealth in Bitcoin and seek to understand the long-term impact of currency debasement and market fluctuations on their daily expenses. Let's dive into the latest data and see how our purchasing power stacks up this month.
November CPI Update
According to the latest update via the Federal Reserve Bank of St. Louis on December 11, the Consumer Price Index for All Urban Consumers (CPI-U) increased 0.15 percent on a seasonally adjusted basis in November, the same increase as the previous 3 months.
The all items index increased 2.73 percent for the 12 months ending November, 2024.
Adjusting for Bitcoiners
While the Consumer Price Index (CPI) measures the average change over time in the prices paid by urban consumers for a market basket of consumer goods and services, it needs to be adjusted for those living on a Bitcoin Standard to reflect the cost of those goods and services relative to BTC.
The price of Bitcoin on 11/30/2024 was approximately $96,536.75.
The all items index measured in BTC fell -47.93% for the 12 month ending November, 2024.
I’d also like to note that the $96,536.75 price of BTC is +156.35% from $37,658.08 on 11/30/2023, one year ago. Looking back four years ago, it is +398.06% from $19,382.36 on 11/30/2020.
Bitcoiner Price Index Chart November 2024
Trends
Including this data in my previous analysis of the last decade, the year-over-year trend in CPI remains steady at 0.04%, while the trend in BPI is now -0.18%. This suggests a slow but consistent increase in the cost of goods and services for those living on a US Dollar standard, and a gradual but accelerating decrease in costs for those living on a BTC standard.
It is worth noting that there are extremely sharp increases in BPI seen in 2015, 2019, and 2023, but despite this, the average year-over-year % change in costs of goods and services for Bitcoiners is still decreasing at over 4x the rate that prices are increasing in USD terms.
If you enjoyed this post or found the information useful, follow me here or subscribe for free on substack to receive an email whenever there is a new update!
https://cryptoheathen34.substack.com/