Verna_Smithson on Nostr: BTC has been rising over the past 24 hours. It rose from a low of around $6,2000 to a ...
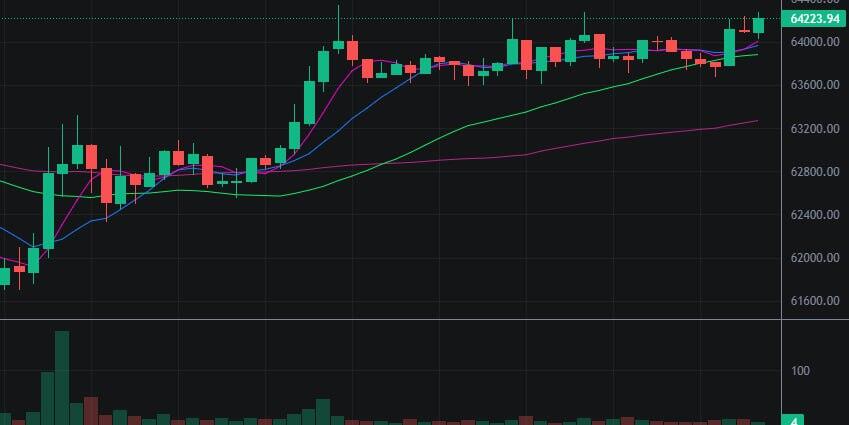
BTC has been rising over the past 24 hours. It rose from a low of around $6,2000 to a high of around $6,4500
It has been around the $6,3000 level and the BTC price is currently overbought
The stochastic indicator is overbought when it is above 80 and oversold when it is below 20. The stochastic indicator is currently trading around 85, suggesting that a pullback in price may be imminent
BTC is currently in a bullish state as indicated by the MACD indicator, which consists of two lines, one fast and one slow. When the fast line is above the slow line, the price is in a bullish state. When the fast line is below the slow line, the price is in a bearish state. the MACD indicator is currently above the 0 line, suggesting that a rise in the price may be imminent
The Bollinger Bands indicator shows that BTC is currently in an oscillator. The Bollinger Bands indicator consists of three lines, an upper rail, a middle rail and a lower rail. When the price is between the upper and middle Bollinger Band, it means that the price is in a state of oscillation. When the price is between the middle and lower Bollinger Bands, it means that the price is falling. When the price is between the upper Bollinger Band and the upper rail, the price is in an uptrend. The Bollinger Band indicator is currently located near the middle rail, indicating that a price shock may be imminent
BTC has been rising over the past 24 hours. The price rose from a low of around $6,2000 to a high of around $6,4500. It has been fluctuating around the $6,3000 level. The stochastic indicator shows that BTC is currently overbought and the MACD indicator shows that BTC is currently bullish. The Bollinger Band Indicator shows that the price of Bitcoin is currently in an oscillator #bitcoin #nostr

