Verna_Smithson on Nostr: The support level is the level at which the price may bounce, while the resistance ...
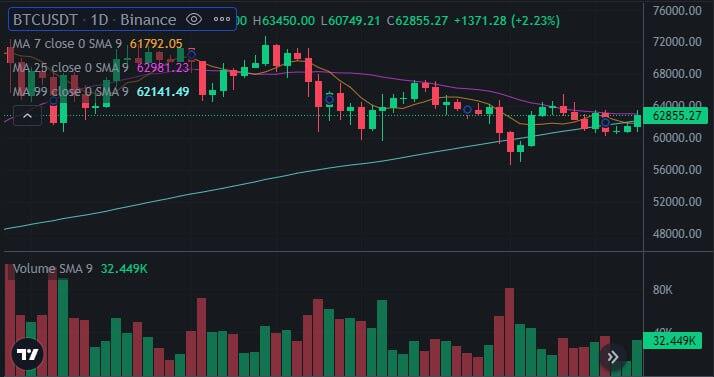
The support level is the level at which the price may bounce, while the resistance level is the level at which the price may fall. We can see the support level near $60,000 and the resistance level near $70,000
The SMA is the average level of the price. We can see the 50-day SMA and the 200-day SMA. the 50-day SMA is the average of the price over the last 50 days, while the 200-day SMA is the average of the price over the last 200 days.
The price of BTC may continue to fall in the short term and may fall further if the price falls below $60,000

Published at
2024-05-13 23:28:03Event JSON
{
"id": "808d89e21df96f2acdda69f7e33232675a75cf8e41c5d72a682c4d51a791ce35",
"pubkey": "407028214587ad0bf40b4765249fc95316d1c608ae12c0c668942fe2eb130cef",
"created_at": 1715642883,
"kind": 1,
"tags": [
[
"imeta",
"url https://image.nostr.build/4d1fd71ca5a6838dff0088d5ef506ed141f7e544c4b95f784c5aec1134477692.jpg",
"blurhash e25OTt+$TJ#AtjE4NxW=NaWB~V-VV]nlkB03X+v*OonPSzX7n6X7Rk",
"dim 714x377"
],
[
"r",
"https://image.nostr.build/4d1fd71ca5a6838dff0088d5ef506ed141f7e544c4b95f784c5aec1134477692.jpg"
]
],
"content": "The support level is the level at which the price may bounce, while the resistance level is the level at which the price may fall. We can see the support level near $60,000 and the resistance level near $70,000\n\nThe SMA is the average level of the price. We can see the 50-day SMA and the 200-day SMA. the 50-day SMA is the average of the price over the last 50 days, while the 200-day SMA is the average of the price over the last 200 days.\n\nThe price of BTC may continue to fall in the short term and may fall further if the price falls below $60,000 https://image.nostr.build/4d1fd71ca5a6838dff0088d5ef506ed141f7e544c4b95f784c5aec1134477692.jpg ",
"sig": "d544d519378b367f34455ed5f4c8b26ed3d560a2324919f52aa6eda2024a80038090f8e01f0c7b39709fbe44639db0fbb7f5089e249aeff65e28321aca332e08"
}


