Verna_Smithson on Nostr: The Bollinger Bands indicator consists of three lines, the upper, middle and lower ...
The Bollinger Bands indicator consists of three lines, the upper, middle and lower rail lines. The upper and lower rail lines are calculated based on the price volatility of a certain period in the past, and the middle rail line is the average price of a certain period in the past. When the price is running near the upper rail line, it means that the price is in an overbought state and may retrace; when the price is running near the lower rail line, it means that the price is in an oversold state and may rebound
The RSI indicator is a measure of price momentum, taking values between 0 and 100. When the RSI indicator is greater than 70, that the price is in an overbought state, there may be a pullback; when the RSI indicator is less than 30, that the price is in an oversold state, there may be a rebound
Deviation indicator is a measure of price and technical indicators of the degree of divergence between the indicators. When the price and technical indicators divergence, that the price may be about to undergo a reversal
Volume is a measure of how actively the market is trading. When the volume increases, it means that the market is actively traded and the price may be about to rise; when the volume decreases, it means that the market is not actively traded and the price may be about to fall
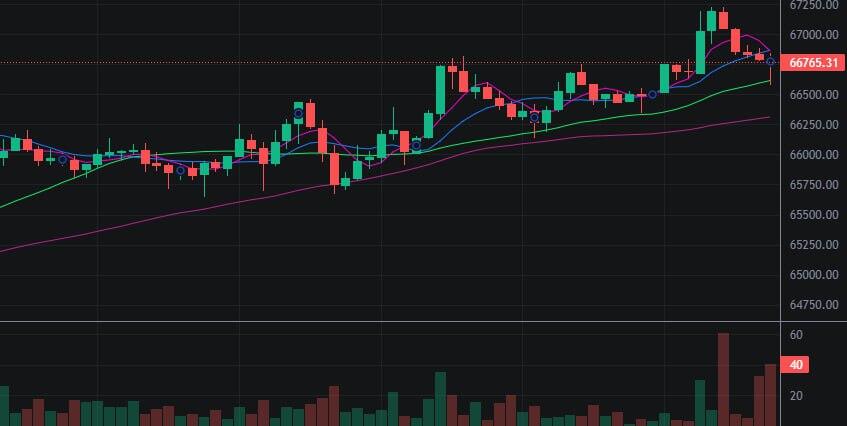
According to the trend chart of the rise and fall to make a judgment. When the price is running near the upper rail line, RSI indicator is greater than 70, divergence indicator divergence, volume increased, that the price may be about to fall #nostr #bitcoin

