
Cian O’Donnell on Nostr: Big fan of this plot showing ASD gene 'risk' on y-axis (i.e. the relative increase in ...
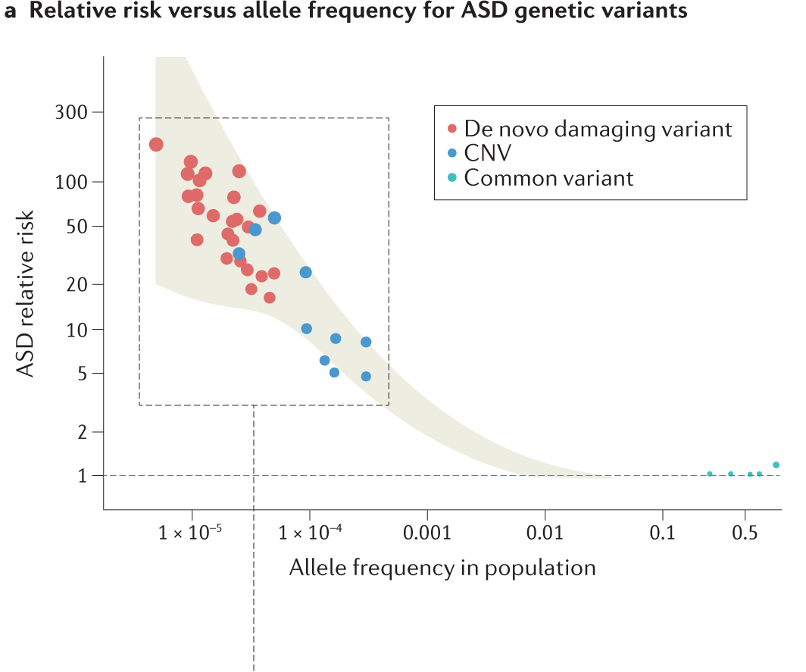
Big fan of this plot showing ASD gene 'risk' on y-axis (i.e. the relative increase in diagnosis likelihood if you have a genetic variant) vs variant prevalence on x-axis (fraction of general population with that genetic variant).
Some high-risk genes that are rare (top left) and other low-risk genes that are common in population.
Common phenomenon seen in many disorders: high impact mutations don't often get propagated to the next generation.
From Willsey et al 2022: https://www.nature.com/articles/s41583-022-00576-7
Some high-risk genes that are rare (top left) and other low-risk genes that are common in population.
Common phenomenon seen in many disorders: high impact mutations don't often get propagated to the next generation.
From Willsey et al 2022: https://www.nature.com/articles/s41583-022-00576-7