jb55 on Nostr: Wasn’t sure the best way to visualize our subscription data, so I gave a very small ...
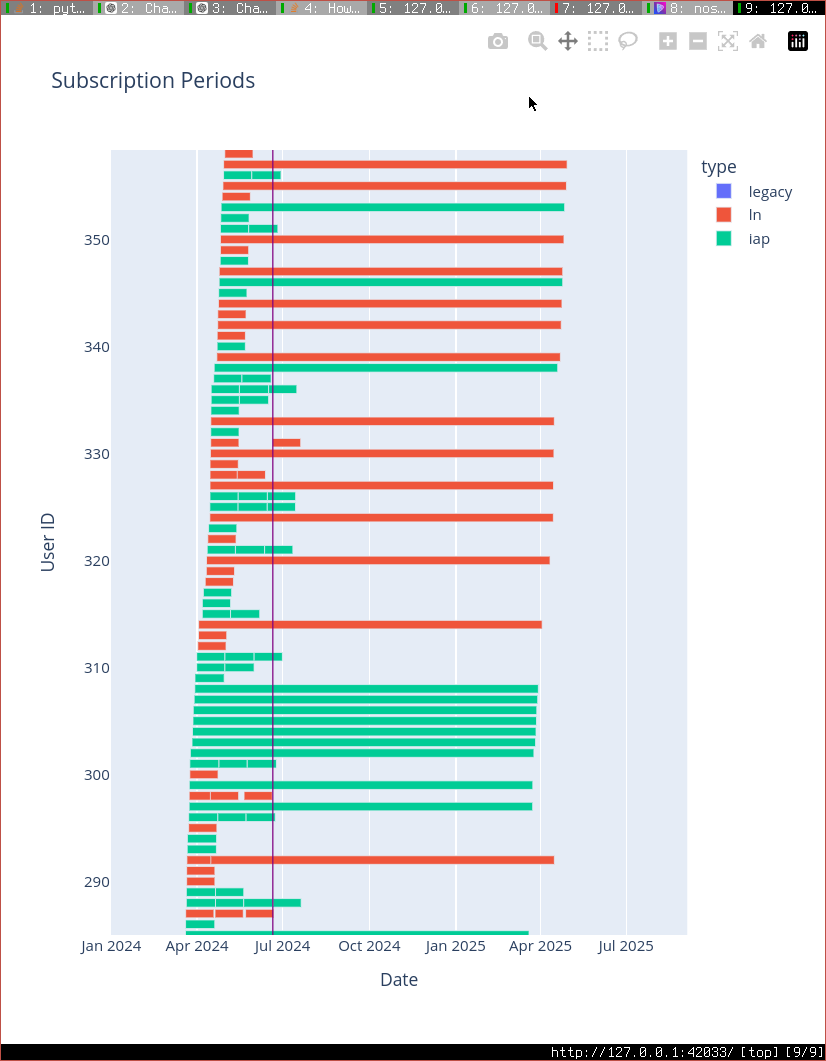
Wasn’t sure the best way to visualize our subscription data, so I gave a very small sample to chatgpt (just sub#, no pubkeys, just start and end dates), and it suggested a gantt chart. Very cool. Not sure I would have thought of this. It even wrote all of the python code and used a library called plotly which i never used before. thank you gpt sensei.

Published at
2024-06-20 18:36:31Event JSON
{
"id": "8786c6f7dfa109d1d880e16f3a0f8f92eede92a7b674796a0b0f1c4f76588b52",
"pubkey": "32e1827635450ebb3c5a7d12c1f8e7b2b514439ac10a67eef3d9fd9c5c68e245",
"created_at": 1718908591,
"kind": 1,
"tags": [
[
"t",
""
],
[
"r",
"https://cdn.jb55.com/s/e9aa91acb9f1aadc.png"
]
],
"content": "Wasn’t sure the best way to visualize our subscription data, so I gave a very small sample to chatgpt (just sub#, no pubkeys, just start and end dates), and it suggested a gantt chart. Very cool. Not sure I would have thought of this. It even wrote all of the python code and used a library called plotly which i never used before. thank you gpt sensei.\n\nhttps://cdn.jb55.com/s/e9aa91acb9f1aadc.png",
"sig": "1d92a8130301a07eea8cee027cf8c33c121f4cec822cddc60d7f29b1bc446941c191f87a14cd7b9fbd1f1a1cdc40eb3b0acbca500bb3dc31832c04039cd51b34"
}


