Event JSON
{
"id": "98fa9215bbaf1b0c77436358ca8438e7bacb83e447756af10fcda5d3a060c510",
"pubkey": "8c721af217b54a71df3db9ffb2f0afe53aeeb3f721efa1853b5cfd591303270a",
"created_at": 1693831979,
"kind": 1,
"tags": [
[
"imeta",
"url https://files.mastodon.online/media_attachments/files/111/006/960/468/991/297/original/3b629f325e6ac9e7.png",
"m image/png"
],
[
"p",
"8c721af217b54a71df3db9ffb2f0afe53aeeb3f721efa1853b5cfd591303270a"
],
[
"e",
"7b0faec9b02a9432ca14c351f642bb4f6ac0fe88b5370670661e9192b4c98804",
"",
"root"
],
[
"e",
"6cd70e619891e55818a2013af02334acec3a633a1d9a6461398cc2ef81bcb296",
"",
"reply"
],
[
"proxy",
"https://mastodon.online/@YaLTeR/111006972622747791",
"web"
],
[
"proxy",
"https://mastodon.online/users/YaLTeR/statuses/111006972622747791",
"activitypub"
],
[
"L",
"pink.momostr"
],
[
"l",
"pink.momostr.activitypub:https://mastodon.online/users/YaLTeR/statuses/111006972622747791",
"pink.momostr"
]
],
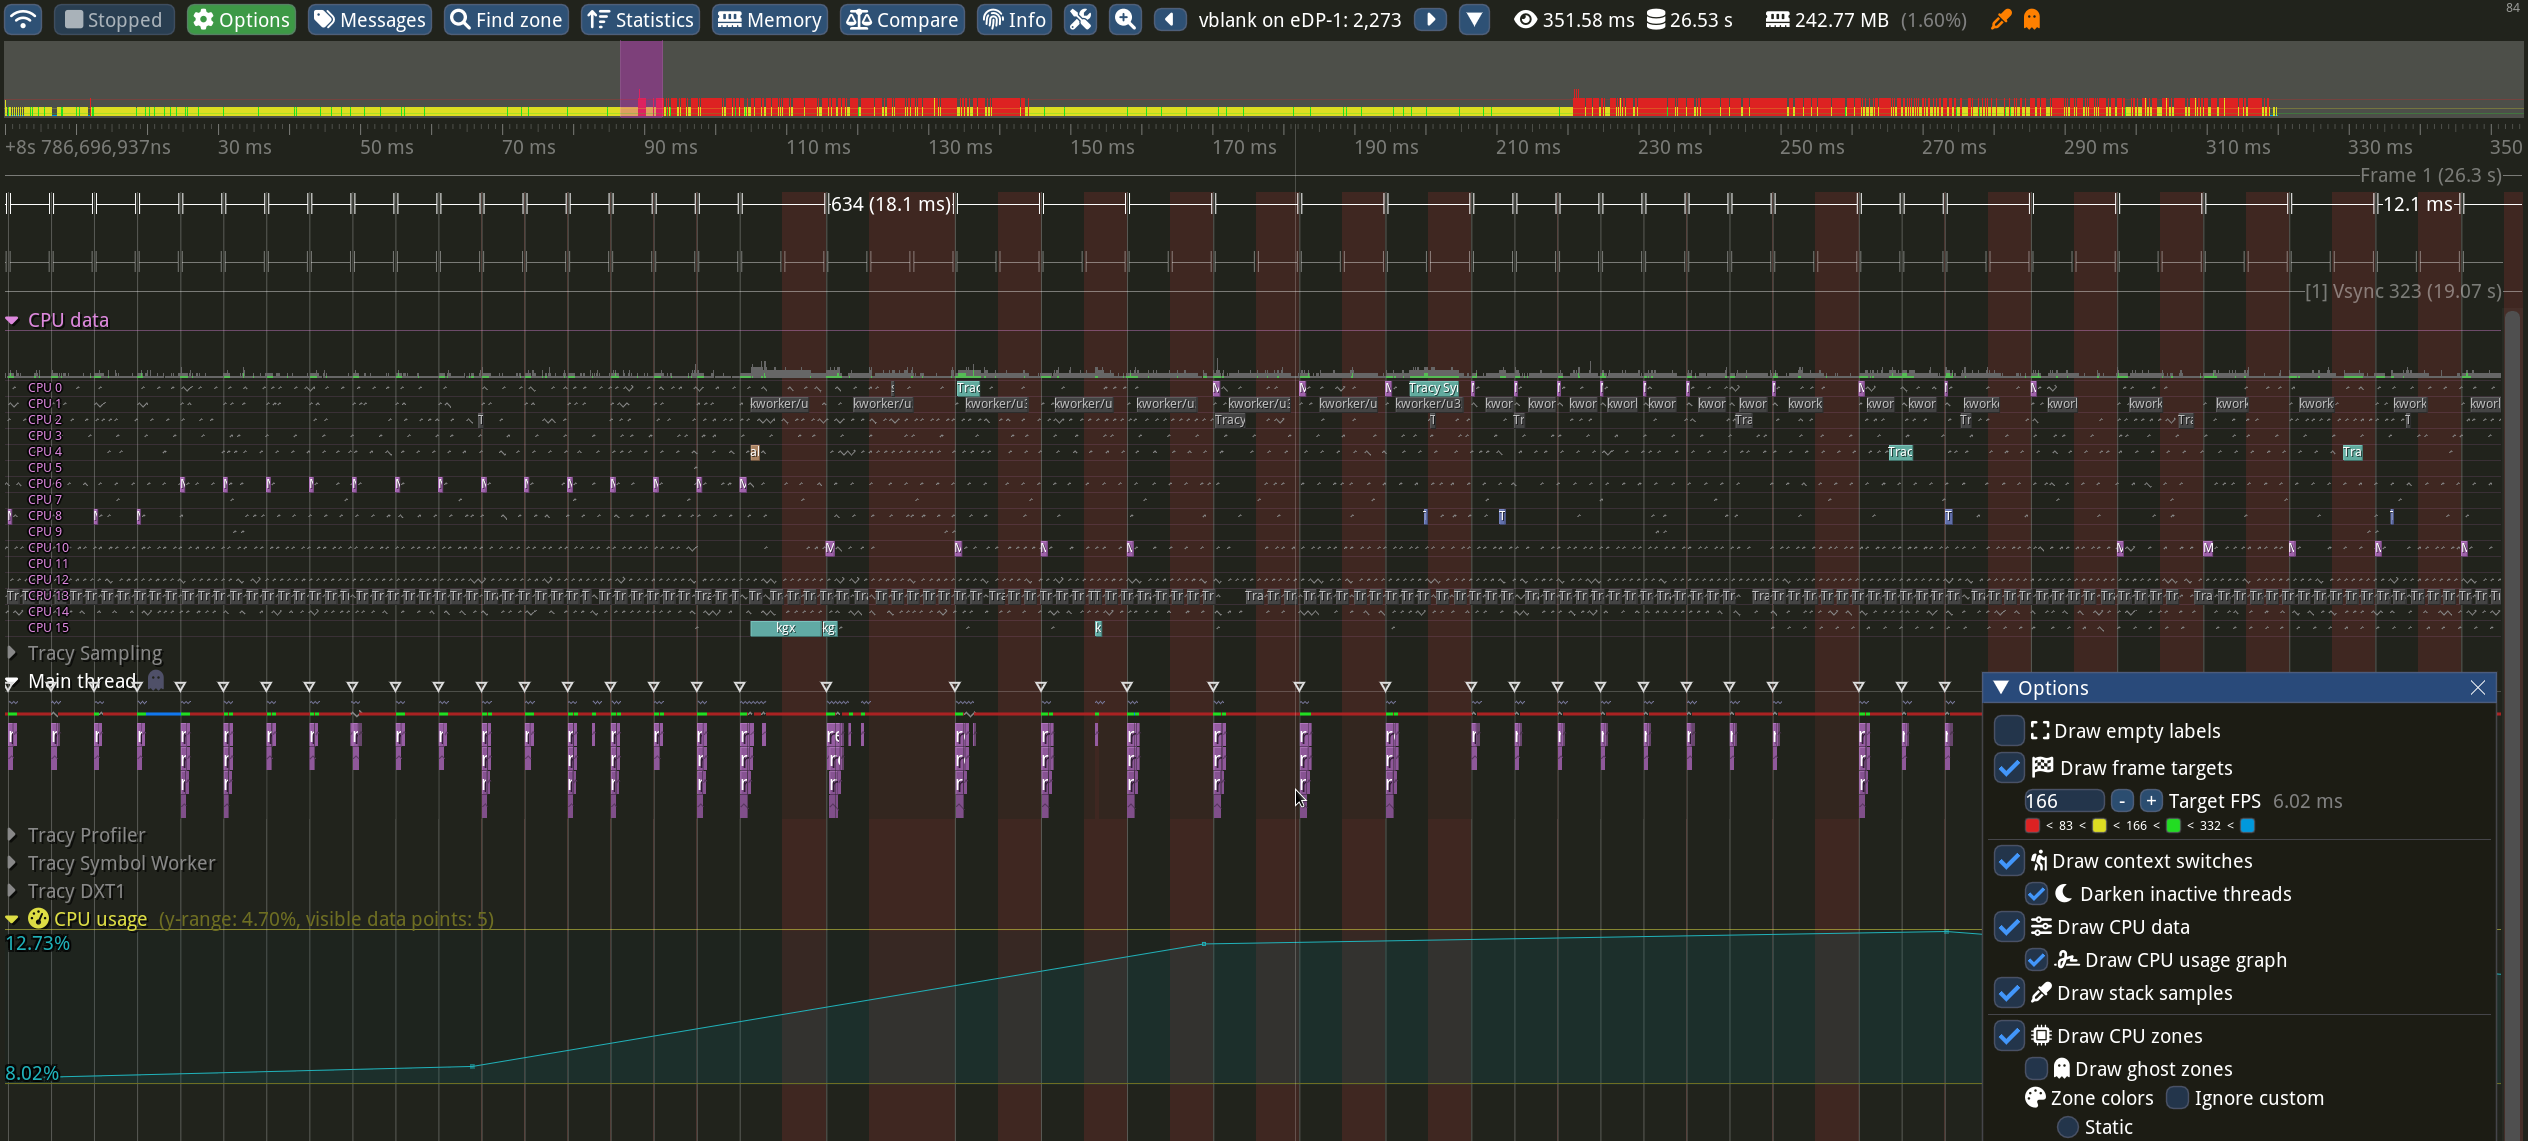
"content": "I'm quite enjoying playing with the Tracy profiler. Turns out when you run the program with sudo, it records a ton of extra useful info, like CPU core scheduling, monitor VSync events, kernel context switches, what your process is blocked on.\n\nI also annotated my compositor with Tracy Frame events for monitor VBlank cycles. I can then set a target FPS in Tracy and instantly see which frames were too slow! Both in the bar at the top, and in the main area highlighted in red.\nhttps://files.mastodon.online/media_attachments/files/111/006/960/468/991/297/original/3b629f325e6ac9e7.png\n",
"sig": "13a4bd99ae71b4a7a0819b3bcc11e1dcb93876ef10e54b20cc3387ac24a72bb1974cf5e28b1c333943eb6e800efd55efb4f5e9aef2aebe318ef8928b3608a3f3"
}

