
CryptoHeathen on Nostr: Bitcoiner Price Index - December 2024 Update The latest update in Consumer Price ...
Bitcoiner Price Index - December 2024 Update
The latest update in Consumer Price Index for All Urban Consumers, adjusted for Bitcoiners
TL;DR: Bitcoiners stay winning.
Introduction
Welcome to this month's edition of the Bitcoiner Price Index (BPI), where we analyze the monthly year-over-year (YoY) Consumer Price Index (CPI) data adjusted for Bitcoin. This ongoing series tracks the cost of living on a Bitcoin Standard, shedding light on how inflation in traditional currency terms compares to deflation in Bitcoin terms. Our goal is to offer a perspective for those who view Bitcoin as their primary measure of value, providing actionable insights into the relative purchasing power of goods and services over time.
Let’s dive into the December 2024 data and evaluate the trends shaping the global economy for Bitcoiners and dollar earners alike.
December 2024 CPI Update
The latest CPI for All Urban Consumers (CPI-U)¹ shows a YoY increase of 2.90% as of December 31, 2024. This marks a continued moderate rise in the USD-based cost of goods and services, reflecting the broader inflationary pressures on the economy.
By contrast, the Bitcoin Price Index (BPI), which adjusts CPI for Bitcoin's price movement, recorded a YoY change of -59.45%, indicating a significant reduction in the BTC-denominated cost of living. This stark difference illustrates Bitcoin's deflationary characteristics, as its value appreciation far outpaces inflationary trends.
Here’s how Bitcoin’s price has performed in this period:
• BTC Price (12/31/2024): $93,897.38²
• One-Year Increase: +120.64% (from $42,556.93 on 12/31/2023)
• Four-Year Increase: +222.54% (from $29,111.52 on 12/31/2020)
Insights for Bitcoiners
The difference between CPI and BPI highlights the impact of Bitcoin’s price volatility and long-term upward trend. Over the past decade:
• USD Trend: CPI has exhibited a consistent average YoY increase of 0.04%, signaling steady inflation in USD terms.
• BTC Trend: BPI shows a declining trend of -0.22% YoY, reflecting the relative deflationary impact for Bitcoiners.
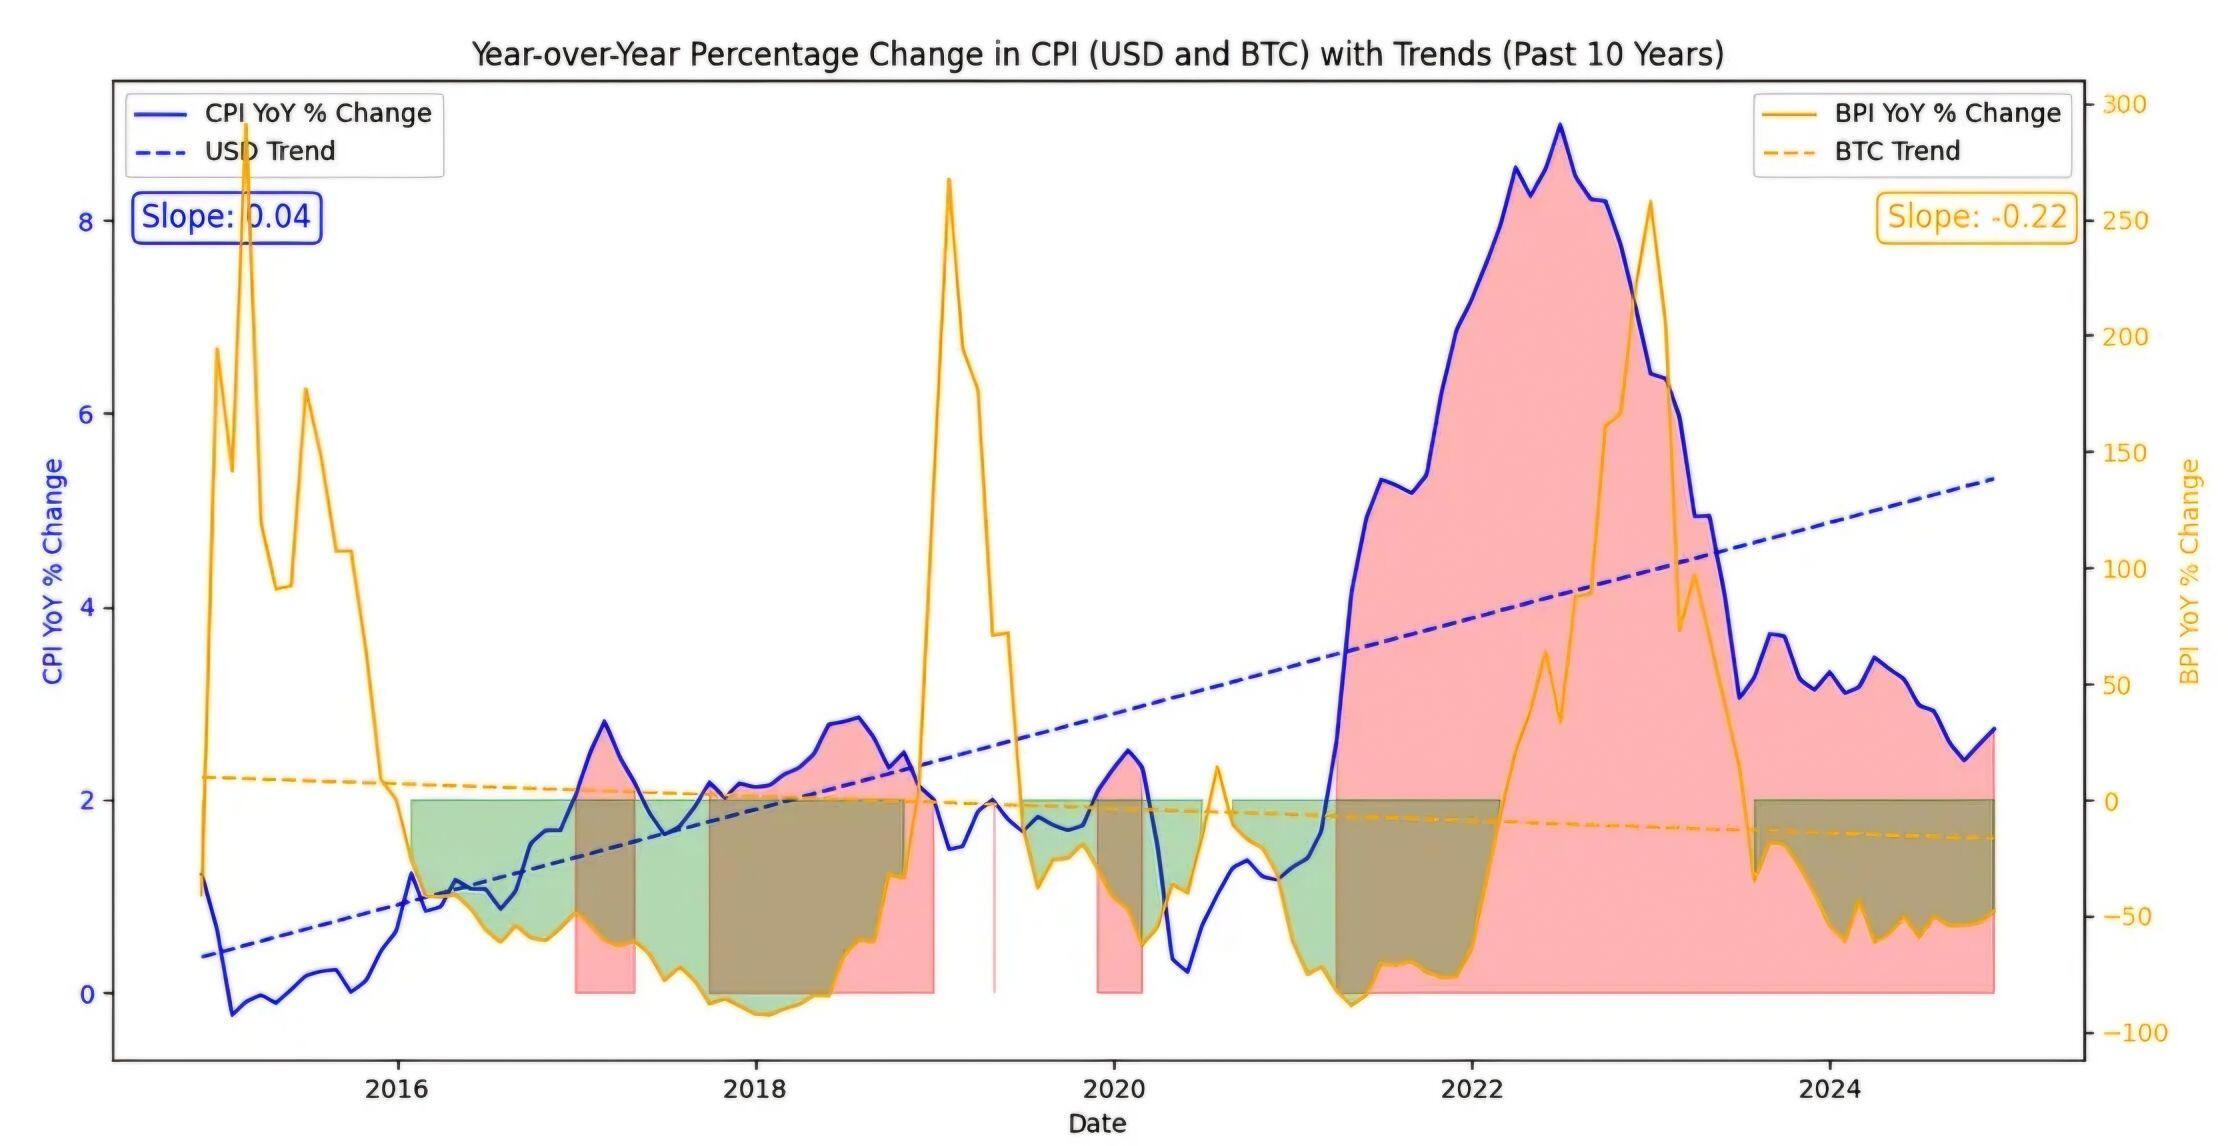
As shown in the chart, the red-shaded area under the CPI line indicates periods where the CPI exceeds the targeted 2% inflation rate, signaling heightened inflationary pressures. Conversely, the green-highlighted area above the BPI line reflects periods when the BPI is negative, indicating a decrease in the cost of living for those living on a Bitcoin Standard. These visual markers help clarify how Bitcoin consistently offsets the effects of USD inflation.
Bitcoin’s price surges in 2015, 2019, and 2023 created temporary spikes in the BPI. However, the overall trend remains downward, showcasing Bitcoin’s ability to lower the relative cost of goods and services for those holding it long-term. This decoupling from USD inflation provides an alternative lens for understanding monetary policy’s effect on purchasing power.
Conclusion
Bitcoin continues to outperform traditional currency as a store of value, not only preserving but expanding purchasing power over time. While USD inflation creeps along at a modest pace, Bitcoin offers a hedge against this trend, driving significant cost-of-living reductions for those who adopt a Bitcoin Standard.
As we enter 2025, these patterns emphasize the potential for Bitcoin as a tool for financial sovereignty. Whether you're new to Bitcoin or a long-time advocate, understanding these dynamics is essential for navigating an evolving global economy.
If you enjoyed this post or found the information useful, subscribe for free and receive an email whenever there is a new post! Paid subscribers get access to regular additional content and community features like comments and chats
https://cryptoheathen34.substack.com/
The latest update in Consumer Price Index for All Urban Consumers, adjusted for Bitcoiners
TL;DR: Bitcoiners stay winning.
Introduction
Welcome to this month's edition of the Bitcoiner Price Index (BPI), where we analyze the monthly year-over-year (YoY) Consumer Price Index (CPI) data adjusted for Bitcoin. This ongoing series tracks the cost of living on a Bitcoin Standard, shedding light on how inflation in traditional currency terms compares to deflation in Bitcoin terms. Our goal is to offer a perspective for those who view Bitcoin as their primary measure of value, providing actionable insights into the relative purchasing power of goods and services over time.
Let’s dive into the December 2024 data and evaluate the trends shaping the global economy for Bitcoiners and dollar earners alike.
December 2024 CPI Update
The latest CPI for All Urban Consumers (CPI-U)¹ shows a YoY increase of 2.90% as of December 31, 2024. This marks a continued moderate rise in the USD-based cost of goods and services, reflecting the broader inflationary pressures on the economy.
By contrast, the Bitcoin Price Index (BPI), which adjusts CPI for Bitcoin's price movement, recorded a YoY change of -59.45%, indicating a significant reduction in the BTC-denominated cost of living. This stark difference illustrates Bitcoin's deflationary characteristics, as its value appreciation far outpaces inflationary trends.
Here’s how Bitcoin’s price has performed in this period:
• BTC Price (12/31/2024): $93,897.38²
• One-Year Increase: +120.64% (from $42,556.93 on 12/31/2023)
• Four-Year Increase: +222.54% (from $29,111.52 on 12/31/2020)
Insights for Bitcoiners
The difference between CPI and BPI highlights the impact of Bitcoin’s price volatility and long-term upward trend. Over the past decade:
• USD Trend: CPI has exhibited a consistent average YoY increase of 0.04%, signaling steady inflation in USD terms.
• BTC Trend: BPI shows a declining trend of -0.22% YoY, reflecting the relative deflationary impact for Bitcoiners.
As shown in the chart, the red-shaded area under the CPI line indicates periods where the CPI exceeds the targeted 2% inflation rate, signaling heightened inflationary pressures. Conversely, the green-highlighted area above the BPI line reflects periods when the BPI is negative, indicating a decrease in the cost of living for those living on a Bitcoin Standard. These visual markers help clarify how Bitcoin consistently offsets the effects of USD inflation.
Bitcoin’s price surges in 2015, 2019, and 2023 created temporary spikes in the BPI. However, the overall trend remains downward, showcasing Bitcoin’s ability to lower the relative cost of goods and services for those holding it long-term. This decoupling from USD inflation provides an alternative lens for understanding monetary policy’s effect on purchasing power.
Conclusion
Bitcoin continues to outperform traditional currency as a store of value, not only preserving but expanding purchasing power over time. While USD inflation creeps along at a modest pace, Bitcoin offers a hedge against this trend, driving significant cost-of-living reductions for those who adopt a Bitcoin Standard.
As we enter 2025, these patterns emphasize the potential for Bitcoin as a tool for financial sovereignty. Whether you're new to Bitcoin or a long-time advocate, understanding these dynamics is essential for navigating an evolving global economy.
If you enjoyed this post or found the information useful, subscribe for free and receive an email whenever there is a new post! Paid subscribers get access to regular additional content and community features like comments and chats
https://cryptoheathen34.substack.com/